37
02/19 PERSONALquarterly
in career ambition for those who customize down. For career
satisfaction, MCC choice interacts with gender and parental
status. Fathers who customized down maintained their level
of career satisfaction which is positive news for MCC and for
an emerging generation of future fathers who are requesting
more flexibility. Fathers usually get punished when reducing
their working hours to take care of their families (e.g. Berdahl/
Moon, 2013), but MCC seems to give fathers an option to com
bine career and care explicitly. However, our findings show
that it is not the same for mothers who customized down, as
their career satisfaction decreased over time. We know from
previous research on customizing careers in terms of time
(i.e. reduced hours) and timing (i.e. taking a career break)
that beside positive effects (e.g increased enjoyment and stress
reduction), mothers on a reduced schedule perceived loss of op
portunities, diminished self-esteem (Hill et al., 2004) and lower
career satisfaction (Valcour/Ladge, 2008). Decreased career
satisfaction may reflect a mother’s own evaluation of how her
career is currently going. Given that customizing down literally
means putting less effort and often less time in at work, these
mothers may perhaps realistically conclude they have achieved
less than before concerning career progress.
In contrast, women without children who customized down
reported unchanged career satisfaction. We assume that these
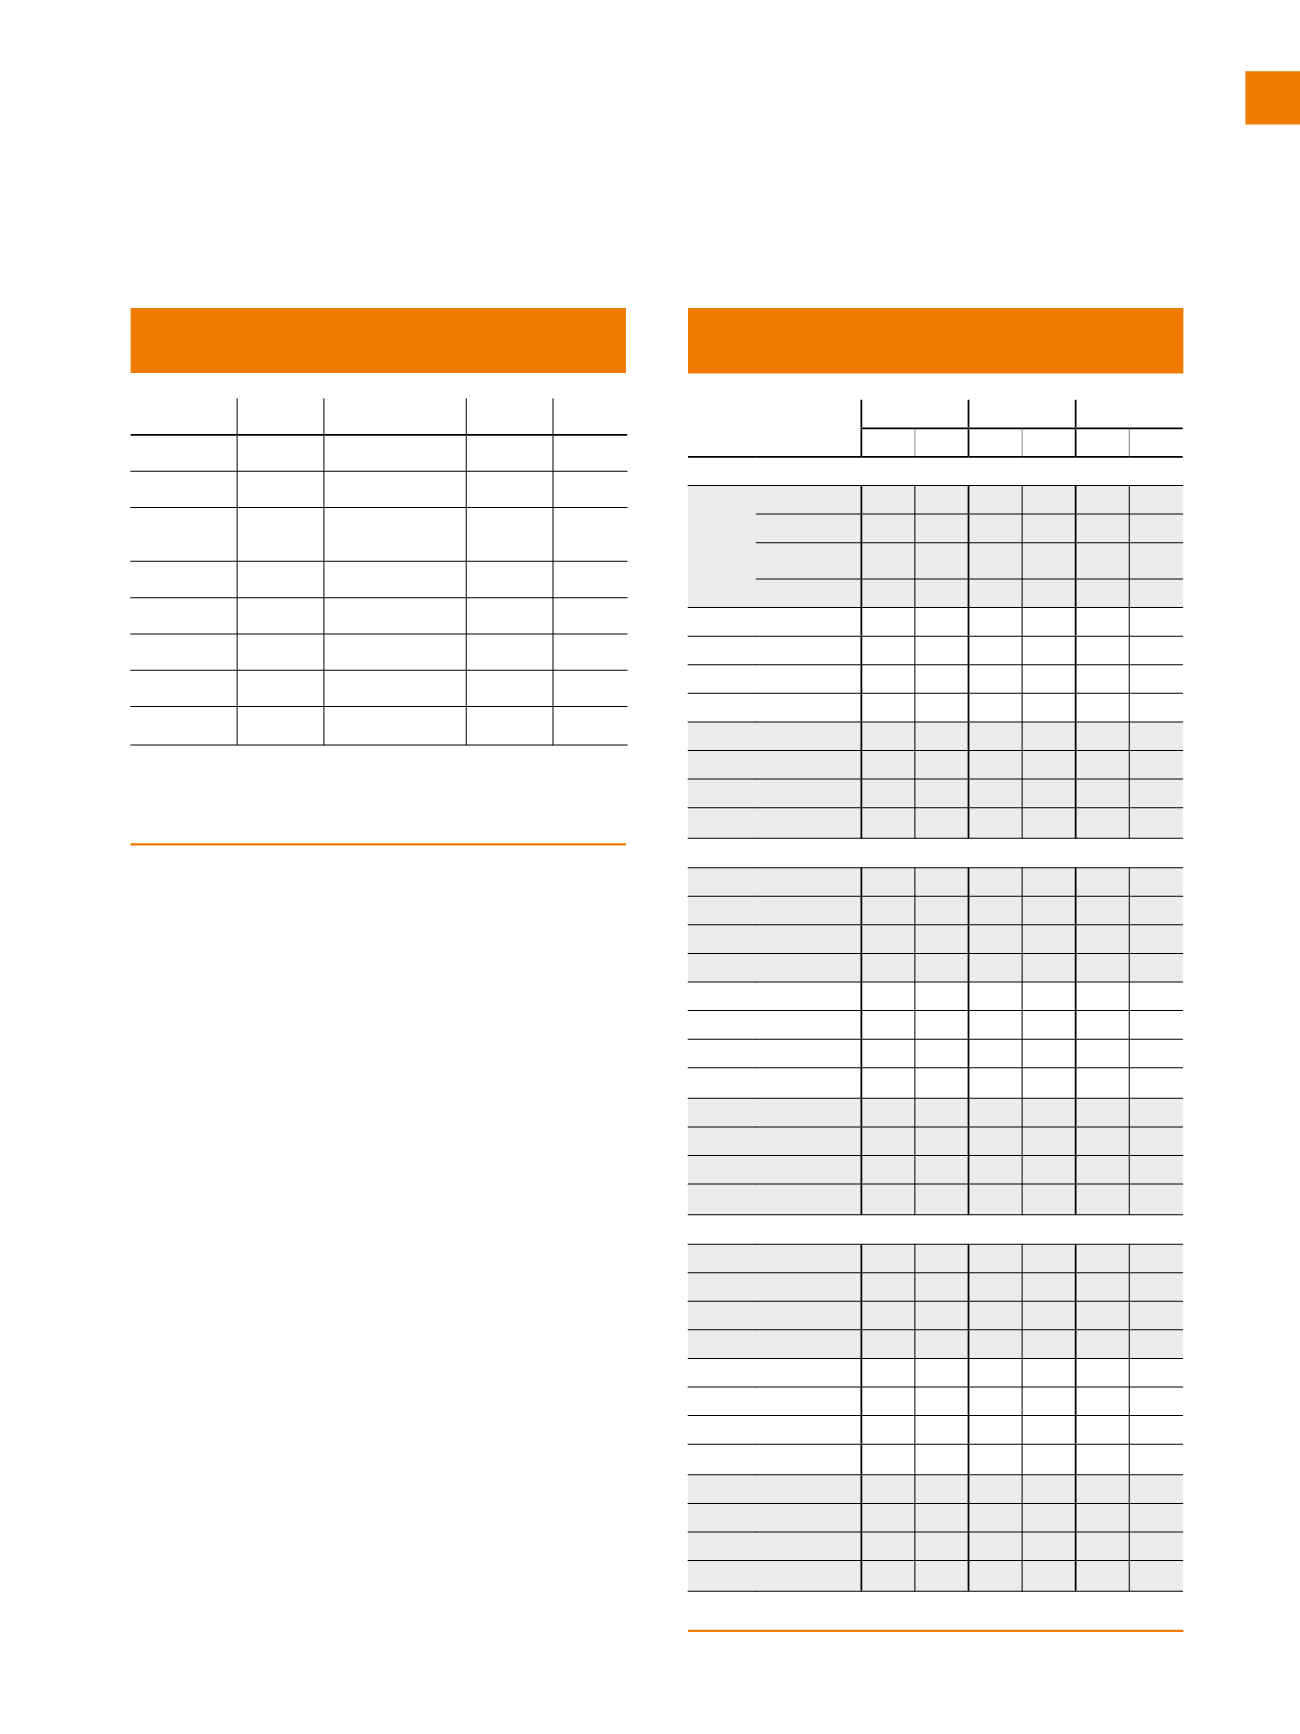
Table 2:
Means as a function of MCC choice, gender,
and parental status at t1, t2, t3
a
no respondents in this category
Source
t1
t2
t3
M SE
M SE
M SE
Career satisfaction
Up
Mothers
a
2.65 .35
Non-mothers
3.62 .19 3.71 .18
Fathers
3.61 .19 3,61 .28
Non-fathers
3.60 .10 3.86 .14
Common Mothers
3.56 .73 3.66 .10 3.53 .10
Non-mothers
3.47 .63 3.58 .06 3.47 .07
Fathers
3.67 .56 3.52 .05 3.61 .05
Non-fathers
3.55 .68 3.54 .04 3.60 .04
Down Mothers
3.48 .11 3.22 .10
Non-mothers
3.56 .17 3.59 .14
Fathers
3.66 .14 3.55 .14
Non-fathers
3.56 .17 3.40 .13
Career ambition
Up
Mothers
a
4.01 .32
Non-mothers
3.83 .16 3.57 .17
Fathers
3.87 .16 4.04 .26
Non-fathers
3.67 .08 3.76 .13
Common Mothers
3.58 .72 3.76 .08 3.70 .09
Non-mothers
3.65 .69 3.64 .05 3.54 .04
Fathers
3.50 .73 3.63 .04 3.61 .04
Non-fathers
3.79 .65 3.64 .03 3.55 .04
Down Mothers
3.54 .10 3.54 .09
Non-mothers
3.40 .15 3.60 .13
Fathers
3.75 .12 3.32 .13
Non-fathers
3.40 .15 3.57 .12
Performance evaluations
Up
Mothers
a
a
Non-mothers
5.20 .43 4.44 .51
Fathers
4.86 .27 5.00 .50
Non-fathers
5.54 .25 4.77 .42
Common Mothers
4.82 .26 4.58 .23 4.96 .25
Non-mothers
5.00 .18 5.12 .14 4.79 .18
Fathers
4.84 .15 5.10 .12 4.81 .12
Non-fathers
4.84 .12 5.00 .10 4.92 .11
Down Mothers
5.31 .30 4.63 .29
Non-mothers
4.94 .43 5.00 .41
Fathers
4.43 .30 4.87 .41
Non-fathers
5.41 .61 6.30 .50
Table 1:
Mediation results for supervisor support,
engagement, and turnover intentions
Independent Mediator
Dependent
Effect size p-value
SSP
Turnover intention
β
= .01
ns
Support
est. = -.12 p < .10
SSP
Turnover intention
β
= -.00 ns
Hindrance
est. = -.11 p < .05
SSP
Work engagement
β
= .04
ns
Support
est. = .04 p < .10
SSP
Work engagement
β
= .06
ns
Hindrance
est. = .02 p < .05
Quelle: Eigene Darstellung
SSP – supervisor support for MCC use, Support and Hindrance refer to perceptions of
organizational culture towards combining career and care. P-values below p = .10 indicate
significance of proposed relationships.
Quelle: Eigene Darstellung


